How bad is pollution in America’s cities? Many people around the world saw a dramatic change in the state of air pollution during the spring of 2020, when streets and highways went quiet during the massive pandemic shutdown.
Cities around the world experienced improved air quality—86% of cities in China experienced cleaner air than the year before, according to IQ Air, a real-time air-quality information platform. India observed markedly improved air quality in 2020 compared with 2019.
But in the U.S., despite the reduced motor vehicle emissions, average air pollution exposure levels across the country were higher in 2020 than in 2018 and 2019. A severe wildfire season and rollbacks of environmental regulations and lack of enforcement of the Clean Air Act contributed to the stagnated and worsening levels of particle pollution in the U.S., according to IQ Air.
During March and April of 2020, the height of the shutdown, levels of fine particulate matter in the air in Los Angeles were “good” at around 5.6 and 8.8 micrograms (one-millionth of a gram) per cubic meter, but began climbing again to ‘moderate’ levels, peaking at 26.3 during September, according to IQ Air. The average for 2020 was 14.6, higher than the 2019 average of 12.7.
This list is a snapshot from mid-2021 of the most polluted cities in the U.S. from Numbeo, a crowd-sourced global database of cost of living and quality of life in cities around the world. Numbeo creates a pollution index that is an estimation of the overall pollution in a city based on surveys of 50,998 people in 5,507 cities around the world, asking the following about pollution:
Satisfaction with air qualityQuality and accessibility of drinking waterWater pollution (in general)Satisfaction with garbage disposalNoise pollution and light pollution during the night in the cityGreen spaces and parks in the cityFeeling of being comfortable to spend time in the city because of the pollutionWhether people find the city clean and tidyThe biggest weight is given to air pollution, then to water pollution/accessibility, two main pollution factors. Small weight is given to other pollution types.
Obviously, pollution varies according to a variety of factors. For example, on July 20-21, 2021 smoke from wildfires in the West, Pacific Northwest and Canada spread across the U.S., darkening the skies and prompting a rash of code red and orange air-quality warnings, and even left the smell of smoke in some places that were far from the fires, according to NASA. On the opposite end of the country, in New York City, levels of fine particulate pollution rose above 170 on the air quality index.
According to Numbeo’s surveys, these are the most polluted cities in the U.S. For perspective, the most polluted city in the world, on a given day, has a pollution score of 95.66 (Kathmandu, Nepal) and the cleanest city (Canberra, Australia) has a score of 13.61.
1. Los Angeles
Pollution score: 66.48 (out of 100)
Shutterstock
2. Salt Lake City
Pollution score: 61.93
Shutterstock
3. Detroit
Pollution score: 58.48
Shutterstock
4. New York
Pollution score: 57.68
iStock
5. Phoenix, Ariz.
Pollution score: 56.31
Shutterstock
6. Houston
Pollution score: 56.23
Shutterstock
7. Philadelphia
Pollution score: 53.72
Miune / Shutterstock
8. Las Vegas
Pollution score: 52.79
Shutterstock
9. New Orleans
Pollution score: 50.65
Shutterstock
10. San Francisco
Pollution score: 47.43
Shutterstock
11. Pittsburgh
Pollution score: 46.17
12. San Jose, Calif.
Pollution score: 45.58
13. Atlanta
Pollution score: 45.08
14. San Antonio, Texas
Pollution score: 44.96
Shutterstock
15. Chicago
Pollution score: 44.77
Shutterstock
16. Sacramento, Calif.
Pollution score: 44.13
Shutterstock
17. Cincinnati
Pollution score: 43.28
Shutterstock
18. Denver
Pollution score: 42.82
Shutterstock
19. Dallas
Pollution score: 41.92
Shutterstock
20. Indianapolis
Pollution score: 41.78
21. Jacksonville, Fla.
Pollution score: 40.27
22. Washington, D.C.
Pollution score: 40.06
Shutterstock
23. Saint Louis
Pollution score: 39.04
24. Miami
Pollution score: 38.91
Shutterstock
25. Honolulu
Pollution score: 36.66
26. Austin, Texas
Pollution score: 36.37
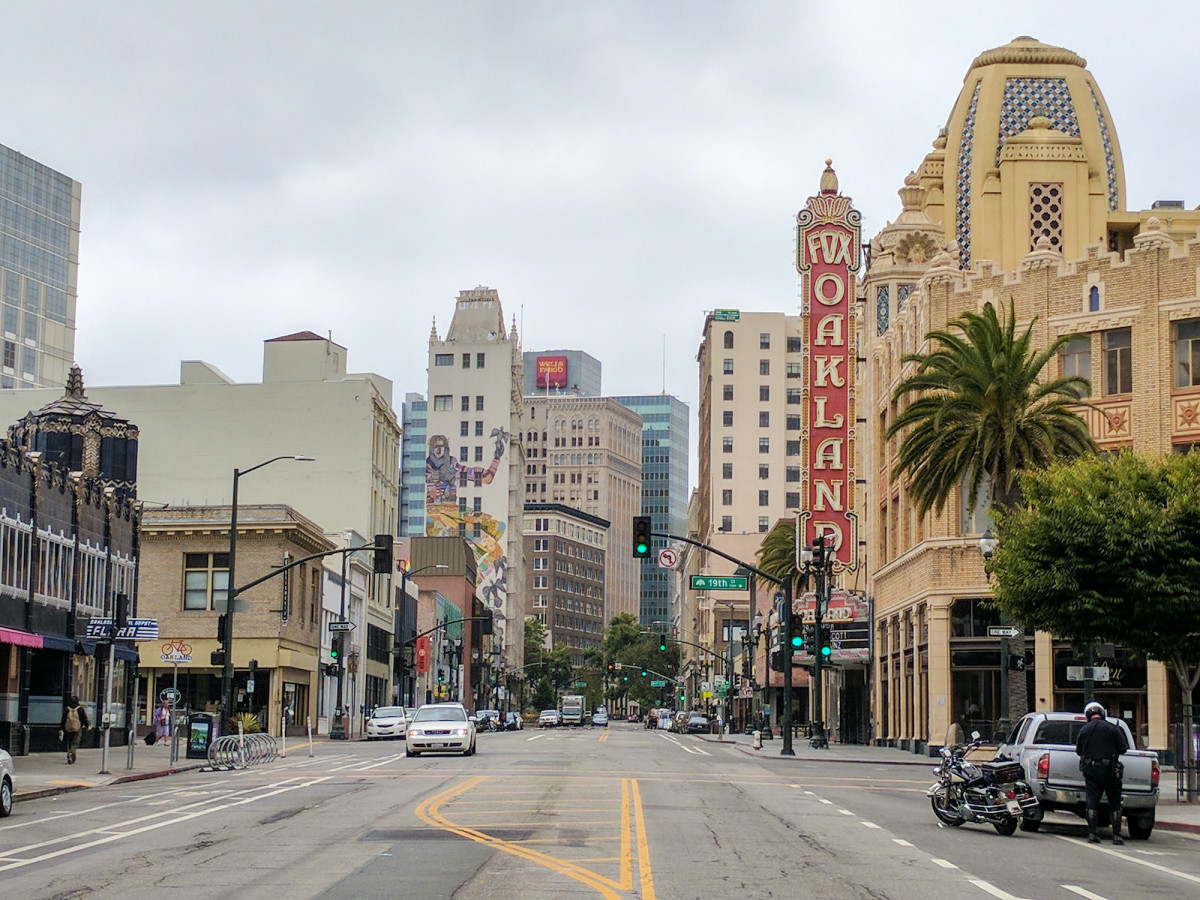
27. Oakland, Calif.
Pollution score: 36.22
28. Nashville, Tenn.
Pollution score: 35.71
Shutterstock
29. Orlando
Pollution score: 35.44
Shutterstock
30. San Diego
Pollution score: 35.05
>> Also see: How Much Money Each State Can Save by Switching to Clean Energy