If you think you don’t have a rooting interest in Sunday’s big game, the Super Bowl Indicator might just change your mind.
Experts, amateurs and idiot savants alike have forever gone to great lengths to divine the direction of share prices. Just as the ancients studied the entrails of sheep, today’s would-be market prognosticators have looked for auguries in shades of lipstick, the production of cardboard boxes, Big Mac prices, the lengths of women’s skirts and the cover of the Sports Illustrated Swimsuit Issue.
All of those subjects and more have been measured, analyzed and tracked to determine the market’s future direction. And in a scant couple of days, we shall receive yet another mystical portent for the future path of the S&P 500:
The great and mighty Super Bowl Indicator.
First coined in 1978 by New York Times sportswriter Leonard Koppett, the Super Bowl Indicator goes like this: If an original National Football League (now the National Football Conference or NFC) team wins the Super Bowl, stocks should rise for the rest of the year. But if the Super Bowl winner is an original American Football League (now the American Football Conference or AFC) team, stocks should fall.
Briefly put, that means as long as you have more of a rooting interest in your 401(k) or IRA than you do either of Sunday’s competitors, you should be pulling for the NFC’s Los Angeles Rams over the AFC’s Cincinnati Bengals.
However, going by more recent results, investors might want to cheer for a little less Hollywood and a lot more Skyline.
Super Bowl Indicator: By the NumbersBefore we dive any deeper, we’ll quickly remind anyone who needs reminding that the Super Bowl has absolutely no effect on the stock market. None whatsoever.
But then, what is life without a little nonsense?
Again, the Super Bowl Indicator originally postulated that stocks will rise for the full year if an NFC team wins the “big game,” and fall if the AFC wins. As of 1978, when Koppett introduced the supposed market signal, it had a completely accurate track record. (With a big fat asterisk in that the Pittsburgh Steelers, an AFC team, were counted as an NFC team because the franchise’s origins were in the original NFL.)
Since then, the Super Bowl Indicator hasn’t been quite as laser-precise, but generally it has maintained its NFC-good, AFC-bad trend.
Sign up for Kiplinger’s FREE Closing Bell e-letter: Our daily look at the stock market’s most important headlines, and what moves investors should make.
Ryan Detrick – chief market strategist for independent broker-dealer LPL Financial, and lifelong “Bungles” fan – is as biased a source as you could find on the subject. But even he admits that the “data don’t lie”: Over the past 55 Super Bowls in which the NFC team prevailed, “the S&P 500 Index has performed better, and posted positive gains with greater frequency,” Detrick says.
Moreover, the S&P 500 produced a 10.8% average annual gain in years the NFC hoisted the Vince Lombardi Trophy, but merely a 7.1% improvement when the AFC did the same.
Similarly, the S&P 500 finished positive 79.3% of the time in years in which the NFC produced a Super Bowl champion, versus just 65.4% for the AFC.
LPL Financial, FactSet (1967-2021)
But why, oh why, would one suggest you side with people who think chocolate and cinnamon belong in their chili?
Because recent history favors the American Football Conference.
“Stocks have actually done just fine lately when the AFC has won,” Detrick says. “In fact, the S&P 500 Index gained 10 of the past 11 years after an AFC Super Bowl champ.”
Indeed, the average S&P 500 return across those 11 wins, dating back to 2004, is 14.4%.
Curiously, the lone negative year in that stretch came in 2015, when the S&P 500 slipped 0.7%. So what exactly transpired that year? Tom Brady won his fourth Super Bowl with the Patriots … two weeks after the “Deflategate” scandal. Feel free to blame that blip on some underinflated footballs, too.
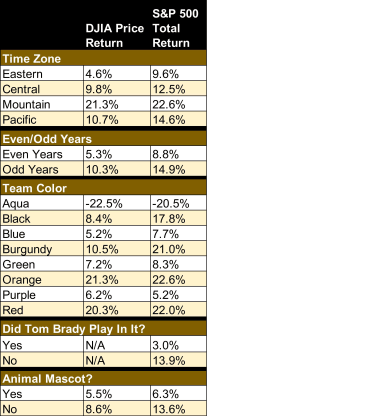
While We’re At It …Although it’s no more applicable than the Super Bowl Indicator, Cetera Investment Management’s broader list of stock-market performance breakdowns based on Super Bowl winners is every bit as entertaining.
Rather than examine conference affiliation, Cetera Chief Investment Officer Gene Goldman – a Patriots fan, and therefore spoiled – looked at more critical team attributes, such as which time zone the team hails from, what kind of mascot it has, and even team color.
“The S&P 500 has an average total return of 22.6% the rest of the year when the winning team’s primary color is orange,” Cetera tweeted recently. “It’s only 7.7% when a blue team wins. Sorry #Rams.”
Cetera Investment Management
Notably, 2021 likely marked the last year we’d be able to measure market returns after a Tom Brady Super Bowl performance, because the eight-time Lombardi Trophy winner recently announced his retirement.
That might be happy or sad news depending on your sports allegiances. But anyone with skin in the market game is better off for it.
Sure, a Tom Brady win has historically been great for markets, with the market up 9% on average, versus a 10.4% market decline in years he lost.
“Among his many other accolades, perhaps Tom Terrific should also be known for the ‘Brady Indicator,” Detrick says. “After all, every time he won the big game, stocks did well. And when he lost, they didn’t.”
Overall, however, in years during which Touchdown Tom has taken the field in a Super Bowl, the S&P 500 has averaged a meager 3% return. But if Brady – who despite his countless accolades couldn’t outplay Ohio State’s Joe Germaine – is watching the game at home? Stocks are putting up gains of more than 13%.
Happy trails, Tom.
Kyle Woodley was a Cleveland Browns fan as of this writing, and just about everything in this column brings him pain.
