Here is a quick primer explaining what a steep, flat or inverted yield curve means
Author of the article:
Reuters
David Randall and Davide Barbuscia and Saqib Iqbal Ahmed
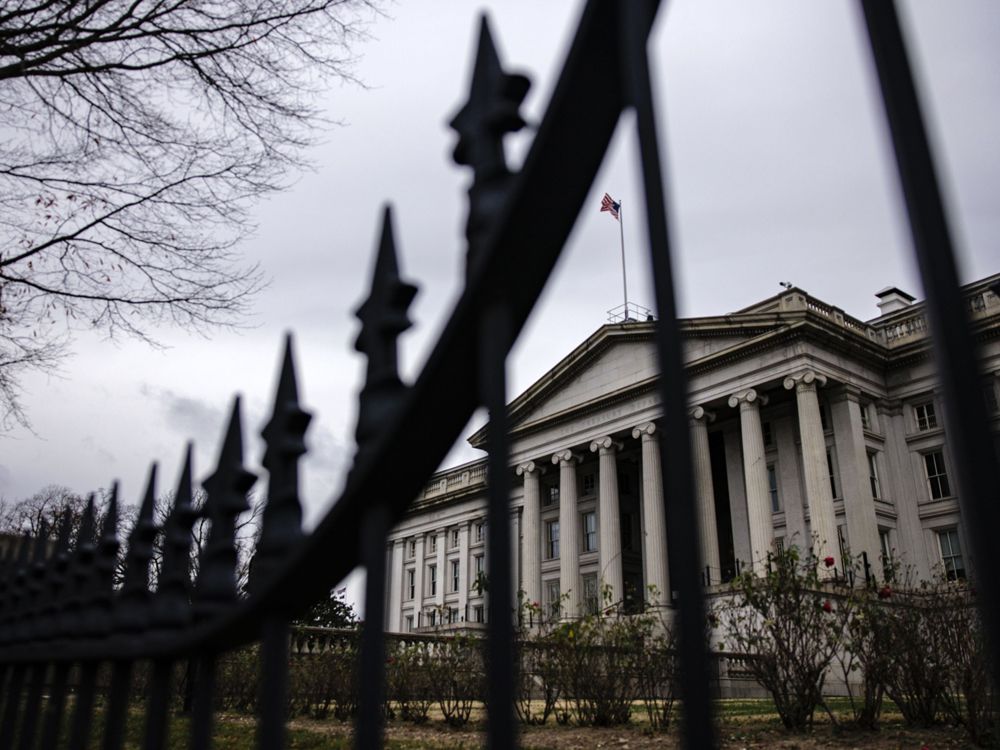
The U.S. Treasury building in Washington, D.C. Photo by Samuel Corum/Bloomberg files NEW YORK — The United States Treasury yield curve inverted on Tuesday for the first time since 2019, as investors priced in an aggressive rate-hiking plan by the U.S. Federal Reserve as it attempts to bring inflation down from 40-year highs.
Advertisement 2 This advertisement has not loaded yet, but your article continues below.
Here is a quick primer explaining what a steep, flat or inverted yield curve means and how it has in the past predicted recession, and what it might be signalling now.
What should the curve look like? The U.S. Treasury finances federal government budget obligations by issuing various forms of debt. The US$23-trillion Treasury market includes Treasury bills with maturities from one month out to one year, notes from two years to 10 years, as well as 20- and 30-year bonds.
Article content The yield curve plots the yield of all Treasury securities.
Typically, the curve slopes upwards because investors expect more compensation for taking on the risk that rising inflation will lower the expected return from owning longer-dated bonds. That means a 10-year note typically yields more than a two-year note because it has a longer duration. Yields move inversely to prices.
This advertisement has not loaded yet, but your article continues below.
Article content A steepening curve typically signals expectations of stronger economic activity, higher inflation and higher interest rates. A flattening curve can mean the opposite: investors expect rate hikes in the near term and have lost confidence in the economy’s growth outlook.
What does an inverted curve mean? Investors watch parts of the yield curve as recession indicators, primarily the spread between the yield on three-month Treasury bills and 10-year notes and the U.S. two-year to 10-year (2/10) curve.
On Tuesday, the 2/10 part of the curve inverted, meaning yields on the two-year Treasury were actually higher than the 10-year Treasury. That is a warning light to investors that a recession could follow.
The U.S. curve has inverted before each recession since 1955, with a recession following between six and 24 months, according to a 2018 report by researchers at the Federal Reserve Bank of San Francisco. It offered a false signal just once in that time.
This advertisement has not loaded yet, but your article continues below.
Article content According to Anu Gaggar, global investment strategist at Commonwealth Financial Network, who looked at the 2/10 part of the curve, there have been 28 instances since 1900 where the yield curve has inverted; in 22 of these episodes, a recession has followed. The lag between curve inversion and the start of a recession has averaged about 22 months, but has ranged from six to 36 months for the last six recessions, she wrote.
The last time the 2/10 part of the yield curve inverted was in 2019. The following year, the U.S. entered a recession — albeit one caused by the global pandemic.
Why is the yield curve inverting now? Yields of short-term U.S. government debt have been rising quickly this year, reflecting expectations of a series of rate hikes by the Fed, while longer-dated government bond yields have moved at a slower pace amid concerns policy tightening may hurt the economy.
This advertisement has not loaded yet, but your article continues below.
Article content As a result, the shape of the Treasury yield curve has been generally flattening and, in some cases, inverting.
Other parts of the yield curve have also inverted, including the spread between five- and 30-year U.S. Treasury yields, which this week moved below zero for the first time since February 2006, according to Refinitiv data.
Are we getting mixed signals? Still, another closely monitored part of the curve has been giving off a different signal. The spread between the yield on three-month Treasury bills and 10-year notes this month has been widening, causing some to doubt a recession is imminent.
Meanwhile, the two-year/10-year yield curve has technical issues, and not everyone is convinced the flattening curve is telling the true story. They say the Fed’s bond-buying program of the last two years has resulted in an undervalued U.S. 10-year yield that will rise when the central bank starts shrinking its balance sheet, steepening the curve.
This advertisement has not loaded yet, but your article continues below.
Article content Researchers at the Fed, meanwhile, put out a paper on March 25 that suggested the predictive power of the spreads between two- and 10-year Treasuries to signal a coming recession is “probably spurious,” and suggested a better herald of a coming economic slowdown is the spread of Treasuries with maturities of less than two years.
What does this mean for the real world? While rate increases can be a weapon against inflation, they can also slow economic growth by increasing the cost of borrowing for everything from mortgages to car loans.
Aside from signals it may flash on the economy, the shape of the yield curve has ramifications for consumers and businesses.
Tom Bradley: Getting back to normal is great, unless you’re an investor David Rosenberg: Three investing themes beyond energy in these uncertain geopolitical times Five times investing professionals got it wrong — very wrong When short-term rates increase, U.S. banks tend to raise their benchmark rates for a wide range of consumer and commercial loans, including small-business loans and credit cards, making borrowing more expensive for consumers. Mortgage rates also rise.
When the yield curve steepens, banks are able to borrow money at lower interest rates and lend at higher interest rates. Conversely, when the curve is flatter, they find their margins squeezed, which may deter lending.
© Thomson Reuters 2022
Financial Post Top Stories Sign up to receive the daily top stories from the Financial Post, a division of Postmedia Network Inc.
By clicking on the sign up button you consent to receive the above newsletter from Postmedia Network Inc. You may unsubscribe any time by clicking on the unsubscribe link at the bottom of our emails. Postmedia Network Inc. | 365 Bloor Street East, Toronto, Ontario, M4W 3L4 | 416-383-2300