Martin Pelletier: Investors should consider selling the rallies and rotating into value instead of chasing those duration dips
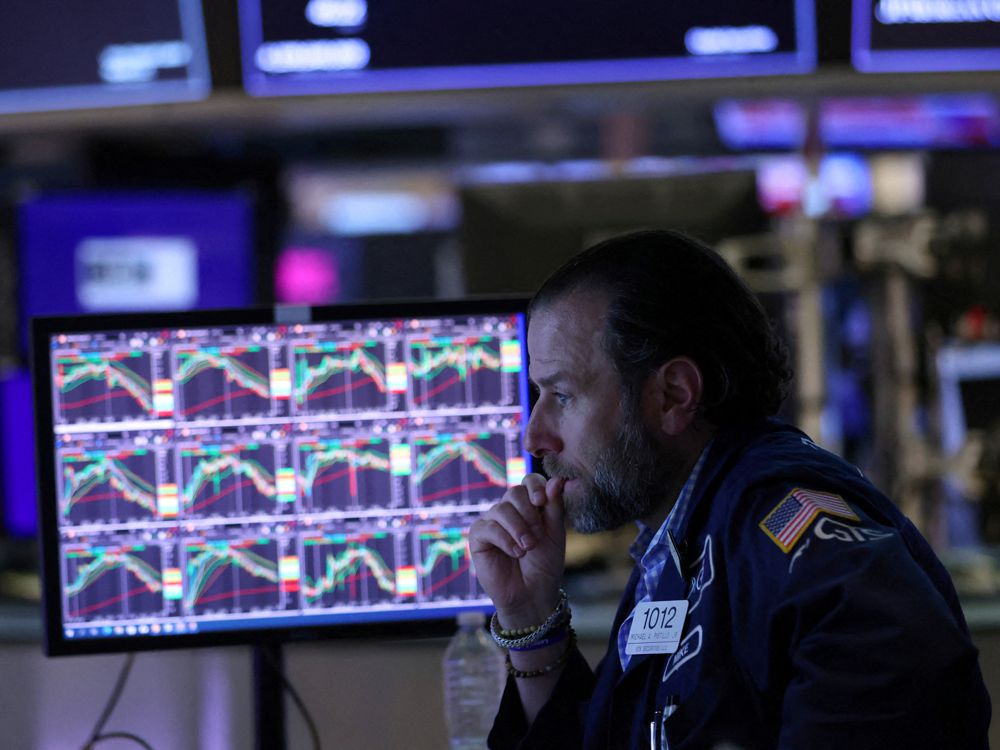
A trader works on the trading floor at the New York Stock Exchange. Photo by REUTERS/Andrew Kelly/File Photo/File Photo This year’s market correction is not about recession risks as much as the pundits say it is.
Advertisement 2 This advertisement has not loaded yet, but your article continues below.
For example, there were two notable highlights from the United States’ gross domestic product report last week that we think say a lot. Excluding the pandemic swings, household spending increased, with outlays for goods at their highest level in five years, while compensation for employees rose 3.8 per cent, the largest quarterly gain since 1981.
If the broader economy is doing so well, then what exactly is causing the market selloff? We don’t think it’s a coincidence that those making the loudest noise about the economic risks of rising rates also happen to have the largest duration exposure and the largest losses.
We have become a society addicted to monetary easing and ultra-low interest-rate policy. Those segments of the market with the highest level of sensitivity to interest rates did extremely well over the past decade, but are the ones doing the worst in this correction, because central bankers such as the U.S. Federal Reserve have no choice but to start tightening after allowing inflation to run rampant for way too long.
Advertisement 3 This advertisement has not loaded yet, but your article continues below.
Take a look at the S&P/TSX composite index, which, thanks to its higher weighting to inflationary segments such as energy, is the best-performing market, with just a 5.3 per cent drop in the past 12 months. As one goes up the duration curve, the returns get much worse: the S&P500 is down nearly 13 per cent, while 20-year-plus Treasuries and the Nasdaq are both down nearly 24 per cent.
For those wondering how this could get any worse, consider that the Nasdaq is still up an annualized 19.5 per cent over the past five years and near an annualized 19 per cent over the past 10 years.
One shouldn’t forget that the S&P/TSX composite has been termed a value trap given its exposure to more traditional segments such as energy, financials, materials and industrials, which underperformed during the falling interest-rate environment over the past decade. However, we think it’s finally time for these segments to shine as we enter a period of monetary tightening, thereby replacing the value trap with what we call the duration trap.
Advertisement 4 This advertisement has not loaded yet, but your article continues below.
That said, we can’t blame investors for plowing into this duration trap headfirst, and thinking central bankers will surely capitulate eventually, with the pace and size of their rate hikes returning us to the deflationary days of old. This reminds us a lot of those touting the value trade in 2009 or 2010, trying to chase a decade or so of outperformance.
In our opinion, the recent rally of six per cent to 7.5 per cent off the lows in the past week and a half isn’t a sign of a market bottom, but just another bear-market duration trap. We don’t see a bottom until there is a complete washout of those buying the highest-duration segments of the market, such as what transpired during the bursting of the 2000 tech bubble.
More On This Topic Remaking once solid investing strategies for today’s markets Here’s a better strategy for investors than trying to catch falling knives Here’s how to turn the gut-wrenching test of a market correction to your advantage This advertisement has not loaded yet, but your article continues below.
Article content But retail investors keep buying the dip, with net inflows into tech-heavy U.S. equities at US$1.3 billion a day on average on a three-month basis, which is near all-time highs, according to Vanda Research Ltd. and cited on Business Insider.
This buying is even happening at the highest end of the duration curve. For example, the Ark Innovation ETF still recorded positive net inflows in six of the past seven weeks despite getting hammered more than 65 per cent.
Combine this with the recent rebound in credit spreads and the selloff in the Bloomberg Dollar Spot Index, and financial conditions are now looser than they were before the Fed’s first rate hike in March. Think about that.
Taking this a step further, if you take the multiple compression during 2018’s tightening period and apply it to today, we estimate the S&P 500 is discounting that a 2.5-per-cent Fed Funds rate will be enough to take inflation back down to two per cent to 2.5 per cent.
This advertisement has not loaded yet, but your article continues below.
Article content As a result, if inflation sticks around, there is more downside ahead. Instead of chasing those duration dips, investors should perhaps consider selling the rallies and rotating into value.
Martin Pelletier, CFA, is a senior portfolio manager at Wellington-Altus Private Counsel Inc, operating as TriVest Wealth Counsel, a private client and institutional investment firm specializing in discretionary risk-managed portfolios, investment audit/oversight and advanced tax, estate and wealth planning.
_____________________________________________________________
For more stories like this one, sign up for the FP Investor newsletter.
______________________________________________________________
Financial Post Top Stories Sign up to receive the daily top stories from the Financial Post, a division of Postmedia Network Inc.
By clicking on the sign up button you consent to receive the above newsletter from Postmedia Network Inc. You may unsubscribe any time by clicking on the unsubscribe link at the bottom of our emails. Postmedia Network Inc. | 365 Bloor Street East, Toronto, Ontario, M4W 3L4 | 416-383-2300
