The bottom line is that the bond market is sending a warning that a Fed policy mistake is increasingly possible
A screen displays the Federal Reserve Chair Jerome Powell on the trading floor at New York Stock Exchange Photo by Andrew Kelly/Reuters files By David Rosenberg and Marius Jongstra
Advertisement This advertisement has not loaded yet, but your article continues below.
The focus for investors during the first six weeks of the year has been on the outlook for United States Federal Reserve policy and economic growth. Indeed, rate hike expectations were ratcheted significantly higher at a time when gross domestic product growth forecasts are being cut by the economic consensus.
The aggressive removal of monetary policy accommodation coupled with a deceleration in the economic outlook is generally not a good mix, a view ratified by the bond market, as short-term yields have shot higher at a faster pace than those on the long end of the curve.
For example, the 2s/10s yield curve is at its flattest point since August 2020 at just 50 basis points, collapsing in half since the beginning of the year, with the potential for inversion if things continue at this pace. We went back to the history books to look at how key asset classes performed in the 12 months following an inversion in order to help guide future asset allocation decisions.
Advertisement This advertisement has not loaded yet, but your article continues below.
From an economic point of view, using the 2s/10s curve as an example, short-term yields rising above their longer-term peers is not a development that should be taken lightly. The historical track record reveals that this event has preceded all six recessions back to 1980, with a median lead time of about one year (14 months, to be specific).
Intuitively this makes sense, with the Fed in a tightening bias influencing short-term rates higher to curb inflationary pressures while growth expectations recede (weighing on long-dated yields). If nothing changes in the outlook, short-term rates eventually exceed those at the long end of the curve and that’s the bond market’s way of saying central bankers have gone too far, and a recession is coming.
Advertisement This advertisement has not loaded yet, but your article continues below.
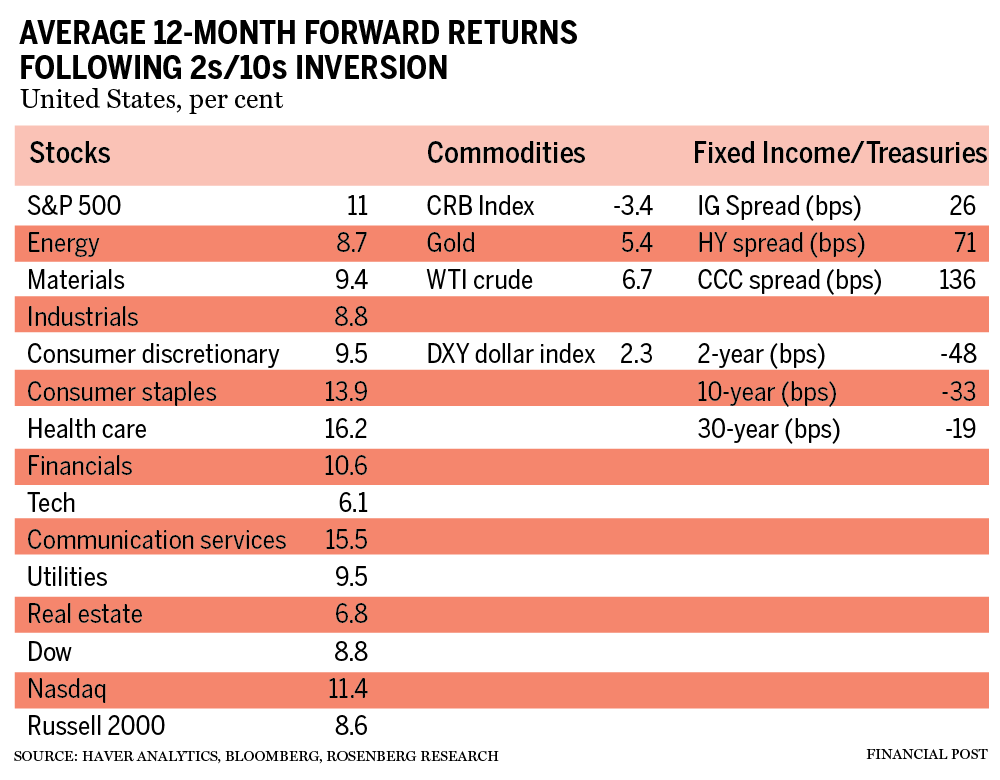
The accompanying table summarizes the average 12-month forward returns for key asset classes we track, including equity sectors, based on these prior six inversions. Interestingly, though perhaps unsurprisingly, the more short-term nature of equity investors (relative to their bond-market peers) is on full display, with stock markets, on average, continuing their gains.
That said, the cyclically sensitive Dow and Russell 2000 underperform the S&P 500 and Nasdaq on rising economic growth concerns. At a sector level, a similar dynamic appears with energy, materials, industrials, consumer discretionary and financials underperforming the broader market. Meanwhile, the more defensive sectors such as consumer staples, health care and communication services (formerly telecom prior to the 2018 GIC sector shuffle) outperform.
Advertisement This advertisement has not loaded yet, but your article continues below.
This development can also be observed in the underperformance in the broad commodity space, as evidenced by the decline in the CRB index, while gold outperforms by an average of eight basis points. The one caveat being West Texas Intermediate crude oil, which historically tends to surge very late cycle with elevated prices contributing to the deteriorating outlook. When it comes to fixed income, corporate bond spreads start to widen out with lower rated product underperforming, favouring investment grade over high yield (we included CCC spreads for reference as well, indicating investors are better off moving up to B and BB ratings if they must maintain some high-yield exposure).
On the U.S. Treasury side, history shows us the curve actually begins to re-steepen even though the damage has been done. Bond markets now start to price in the eventual easing in policy that is coming, with short-term rates falling faster than long-term equivalents. Despite this downward pressure in rate differentials, the U.S. dollar’s safe haven status dominates over the Fed influence — typically rising during this one-year period.
Advertisement This advertisement has not loaded yet, but your article continues below.
More On This Topic David Rosenberg: Global recovery unhealthily hitched to bubbly housing, especially in Canada, New Zealand David Rosenberg: The outlook for Canada’s provinces? Head for the coasts David Rosenberg: NFTs may be nifty, but not when it comes to investing in them David Rosenberg: Finding opportunities in tech despite rising yields The bottom line for investors is that the bond market is sending a warning that a Fed policy mistake is increasingly possible. At just 50 basis points, there is not much margin for error. Looking at previous hiking cycles, the 2s/10s curve is typically more than double this amount when the rate hike cycle begins with the expansion only roughly 30 per cent of the way through.
In this pandemic cycle, where everything has been accelerated, we are closer to 80 per cent through the expansion and half as steep when compared to the norm. Investors will need to keep an eye on this indicator in the coming weeks when the tightening cycle gets underway, for an inversion signals an extreme late cycle development. That means a shift towards defensive equity sectors, despite stocks continuing a blow-off rally, a reduction in broad commodity exposure towards gold and crude, increasing Treasury exposure and focusing on high-rated names in the corporate bond market.
David Rosenberg is founder of independent research firm Rosenberg Research & Associates Inc. Marius Jongstra is a senior economist and strategist there. You can sign up for a free, one-month trial on Rosenberg’s website.
_____________________________________________________________
For more stories like this one, sign up for the FP Investor newsletter.
______________________________________________________________
Financial Post Top Stories Sign up to receive the daily top stories from the Financial Post, a division of Postmedia Network Inc.
By clicking on the sign up button you consent to receive the above newsletter from Postmedia Network Inc. You may unsubscribe any time by clicking on the unsubscribe link at the bottom of our emails. Postmedia Network Inc. | 365 Bloor Street East, Toronto, Ontario, M4W 3L4 | 416-383-2300