The backdrop for stocks is beginning to look more compelling
Traders work on the floor of the New York Stock Exchange. Photo by Michael M. Santiago/Getty Images files By David Rosenberg and Brendan Livingstone
Advertisement This advertisement has not loaded yet, but your article continues below.
Heading into the year, we were bearish on United States equities, a view largely informed by our assessment that valuations were very rich and in need of a reset. Thankfully, after a 12-per-cent peak-to-trough drawdown in the S&P 500 (so far), the backdrop for stocks is beginning to look more compelling.
That said, for us to turn bullish, we believe valuations will need to normalize further. Notably, the S&P 500’s forward P/E of 19.2x is still well above its historical average of 16.2x. However, after the recent selloff, there are industries that are now trading at levels we believe represent good entry points. In our view, this is worth highlighting, and represents the motivation behind a recent stock screen analysis.
Advertisement This advertisement has not loaded yet, but your article continues below.
There are 63 distinct S&P 500 industry groups that we considered. We examined each industry based on: the change in valuations (relative to the start of the year) and how the current forward P/E multiple compares to its historical average. This approach yielded four distinct buckets: Industries where valuations improved, but still have an above-average forward P/E; Industries where valuations worsened, but have a below-average forward P/E; Industries where valuations worsened and have an above-average forward P/E; Industries where valuations improved and have a below-average forward P/E.
Automobiles are the best example of the first bucket mentioned above. This group has had the largest valuation improvement — moving to a forward P/E of 29x currently from 41.2x — but has not yet reached its historical forward price-to-earnings multiple (10.4x). Put differently, while the industry group looks much more appealing than it did at the start of the year, it has further to go to reach an attractive entry point.
Advertisement This advertisement has not loaded yet, but your article continues below.
By comparison, take a look at the energy equipment and services sector, which falls under our second bucket. It started the year at a forward P/E of 13.4x, but now trades at 16x. However, its historical price-to-earnings multiple is 20.4x, meaning the sector remains attractive. In other words, this segment of the market still represents good value, even though it has become more expensive this year. The list of other industries that fall under this bucket is quite short: diversified telecom services, consumer finance, metals and mining, oil, gas and consumable fuels, and wireless telecommunication services.
The worst of both worlds are the industries that are not only trading at an above-average forward P/E, but whose valuation picture has deteriorated so far this year (bucket No. 3). This includes: insurance, food products, gas utilities, tobacco, aerospace and defence, diversified financial services and airlines.
Advertisement This advertisement has not loaded yet, but your article continues below.
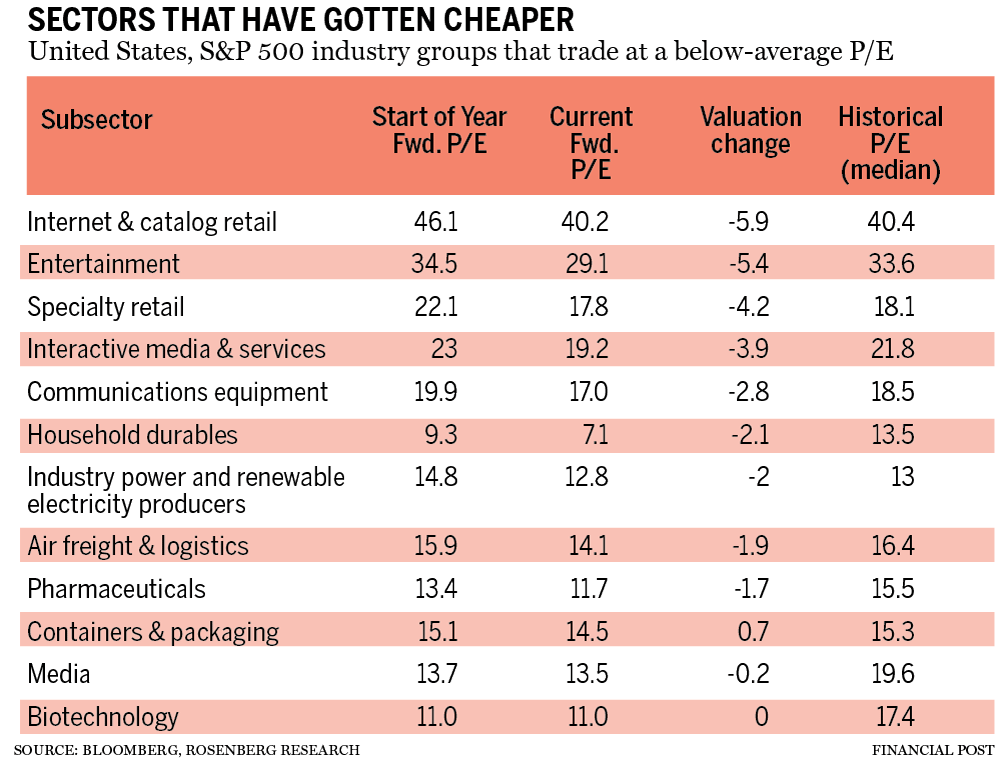
More On This Topic David Rosenberg: How key asset classes performed following a yield curve inversion Worst-case — ‘World War III and I am not being hyperbolic’: David Rosenberg David Rosenberg: Global recovery unhealthily hitched to bubbly housing, especially in Canada, New Zealand The fourth bucket — the primary focus of our analysis — captures industries that have experienced multiple compression this year (that is, valuation improvement) and also trade at a below-average forward P/E. An example of an industry that fits these criteria is internet and catalog retail, which started the year with a forward P/E of 46.1x versus 40.2x currently. Admittedly, this multiple is still elevated, but it is actually a bit less than its historical average (40.4x).
This advertisement has not loaded yet, but your article continues below.
Article content Other industries in this category are: entertainment, specialty retail, interactive media and services, communications equipment, household durables, industry power and renewable electricity producers, air freight and logistics, pharmaceuticals, containers and packaging, media and biotechnology.
The S&P 500 is still trading at an elevated forward P/E relative to its history, but there are an increasing number of industries (19 in total) that have below-average multiples. In our view, these are worth emphasizing in a portfolio, especially as the U.S. Federal Reserve begins the process of removing accommodation. Within this list, we would also have a preference for industries that have had multiple compression (gotten cheaper) this year, as this suggests a more compelling risk/reward profile.
David Rosenberg is founder of independent research firm Rosenberg Research & Associates Inc. Brendan Livingstone is a senior strategist there. You can sign up for a free, one-month trial on Rosenberg’s website.
_____________________________________________________________
For more stories like this one, sign up for the FP Investor newsletter.
______________________________________________________________
Financial Post Top Stories Sign up to receive the daily top stories from the Financial Post, a division of Postmedia Network Inc.
By clicking on the sign up button you consent to receive the above newsletter from Postmedia Network Inc. You may unsubscribe any time by clicking on the unsubscribe link at the bottom of our emails. Postmedia Network Inc. | 365 Bloor Street East, Toronto, Ontario, M4W 3L4 | 416-383-2300