This asset mix gives you the returns of stocks with half the volatility
Looking for the returns of stocks with about half the volatility? David Rosenberg and his team have some suggestions. By David Rosenberg and Brendan Livingstone Advertisement 2 This advertisement has not loaded yet, but your article continues below.
REGISTER TO UNLOCK MORE ARTICLES Create an account or sign in to continue with your reading experience.
Access articles from across Canada with one account Share your thoughts and join the conversation in the comments Enjoy additional articles per month Get email updates from your favourite authors We recently examined what the “ideal” asset mix is based on the historical record, focusing on the traditional allocation between equities and bonds that generate the highest Sharpe ratio (used to assess risk-adjusted returns). We concluded that a 50/50 split between stocks and bonds maximized risk-adjusted performance, slightly beating out the popular 60/40 portfolio.
FP Investor By clicking on the sign up button you consent to receive the above newsletter from Postmedia Network Inc. You may unsubscribe any time by clicking on the unsubscribe link at the bottom of our emails or any newsletter. Postmedia Network Inc. | 365 Bloor Street East, Toronto, Ontario, M4W 3L4 | 416-383-2300
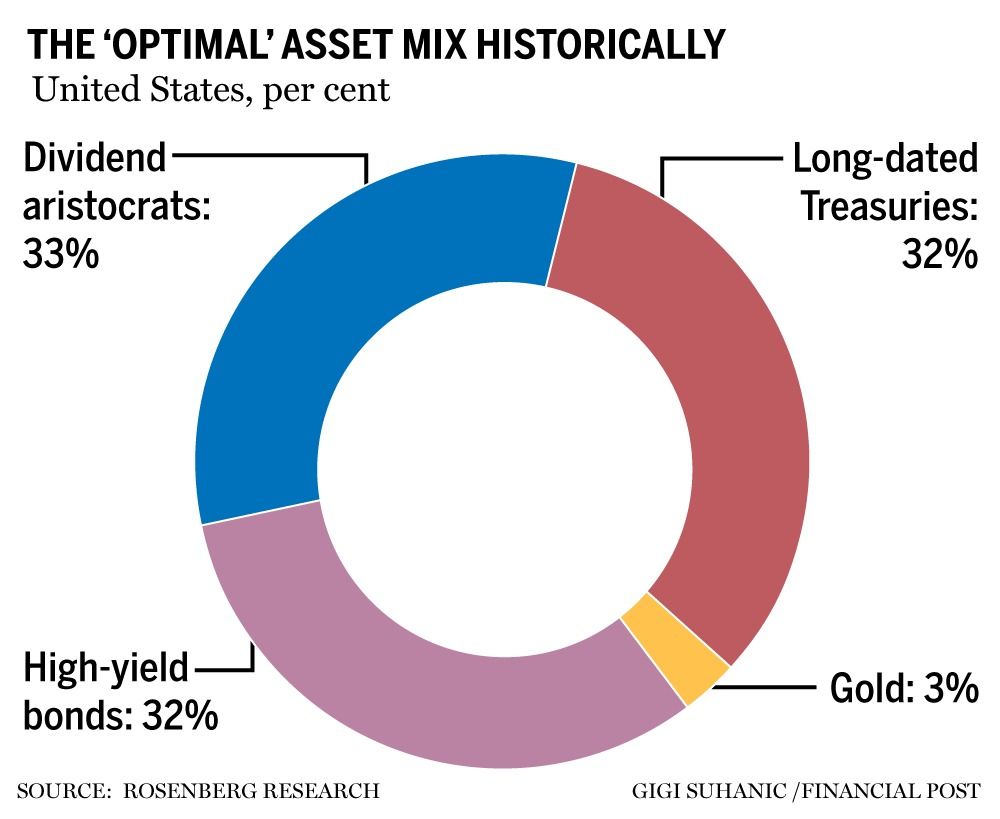
We’ve decided to take this one step further by including additional asset classes in our analysis, and we found that a mix split nearly equally between long-dated United States Treasuries, high-yield bonds and high-paying dividend stocks (as well as a bit of gold) could produce superior risk-adjusted returns.
Indeed, this asset mix resulted in equity-like returns with only about half the volatility. As a result, we believe this is a good option for investors seeking a favourable return stream, while also wanting to reduce the overall volatility of their portfolio.
Advertisement 3 This advertisement has not loaded yet, but your article continues below.
We pulled historical return data (since 1990) across a wide array of public assets, including (but not limited to) various equity indexes, high-yield bonds, investment-grade bonds, Treasuries, commodities, gold and cash. Next, we set up our dataset to automatically solve for the highest Sharpe ratio, with the only constraints being that portfolio weights must add up to 100 per cent (meaning fully invested), and positions must be long only (that is, no short positions). There are an infinite number of hypothetical asset mix combinations that can be produced, but there is only one “optimal” portfolio.
We found that a near-equally weighted portfolio consisting of long-dated Treasuries, high-yield bonds and high-paying dividend stocks (plus a bit of gold exposure) produced the highest Sharpe ratio since 1990. The exact weights of these assets are provided in the accompanying pie chart.
Advertisement 4 This advertisement has not loaded yet, but your article continues below.
One notable observation is that the combined exposure to risk assets (dividend-paying stocks and high-yield bonds) is 64 per cent, whereas the weight in traditional safe havens (long-dated Treasuries and gold) is 36 per cent. This is pretty close to the classic 60/40 portfolio — in terms of the split between risk assets/safe havens — but with a large weight in high yield at the expense of equities. This is because high-yield bonds have returned 7.6 per cent (annualized) over the past three decades, not much worse than equities (9.9 per cent), but with 40 per cent less volatility. In other words, on a risk-adjusted basis, high-yield bonds screen quite favourably.
We would also flag that in terms of equity exposure, this asset allocation model prefers high-paying dividend stocks (specifically, the S&P 500 Dividend Aristocrats Index). This group of stocks has returned 11.9 per cent (annualized) over the past 30-plus years, about two percentage points better than the S&P 500 or the broader Wilshire 5000. Furthermore, the aristocrats have slightly lower volatility, making them a very appealing form of equity exposure.
Advertisement 5 This advertisement has not loaded yet, but your article continues below.
The Sharpe ratio for our optimized portfolio is 0.86. Again, this metric measures risk-adjusted performance (how much excess return you receive for the additional volatility of holding riskier assets), with higher values equating to more favourable results. For reference, the Sharpe ratio of our asset mix is superior to the classic 60/40 (with a Sharpe ratio of 0.62), as well as the 50/50 asset mix we previously identified as maximizing risk-adjusted returns (when the S&P 500 and Treasuries were the only assets under consideration). Note that it is also considerably more favourable than a portfolio of pure equities or pure Treasuries, reinforcing the diversification benefits of a balanced mix.
Recommended from Editorial David Rosenberg: Markets in denial as margins, profits and estimates decline David Rosenberg: A recession is coming to Canada in 2023 amid huge debt, housing bubble David Rosenberg: S&P 500 could drop as low as 2,500 before this bear market is finished This advertisement has not loaded yet, but your article continues below.
Article content The bottom line for those looking to maximize risk-adjusted returns is that a portfolio comprised of near-equal weights in long-dated Treasuries, high-yield bonds and high-paying dividend stocks (as well as a bit of gold) is a very good option. Since 1990, this asset mix has returned nine per cent, very close to the S&P 500 (9.9 per cent), but with just half the volatility.
Another huge benefit is that while the S&P 500 fell more than 50 per cent during the Great Recession, the largest drawdown this asset mix suffered was 20 per cent. We believe the ability of this portfolio to drastically reduce volatility, without suffering on the performance front, should make it worthy of consideration for investors.
David Rosenberg is founder of independent research firm Rosenberg Research & Associates Inc. Brendan Livingstone is a senior market strategist there. You can sign up for a free, one-month trial on Rosenberg’s website.
_____________________________________________________________
If you like this story, sign up for the FP Investor Newsletter.
_____________________________________________________________