Realty Income (O) does not like the rising rate environment, particularly when it comes amid worries about the real estate market and amid the broad bear market in equities.
Here’s Bank of America’s favorite REITs, by the way.
The Federal Reserve continues to raise rates, most recently by 0.75 percentage point. At the same time, the S&P 500 is now at 52-week lows.
Realty Income has taken a hit. The stock is down for six straight weeks and it’s off about 3% so far this week.
That has swelled its dividend yield to 4.9%. Remember, this company pays its dividend monthly and has raised that payout in 99 consecutive quarters.
If it does so again, that will mark an impressive 25 straight years of quarterly increases.
Let’s look at the charts.
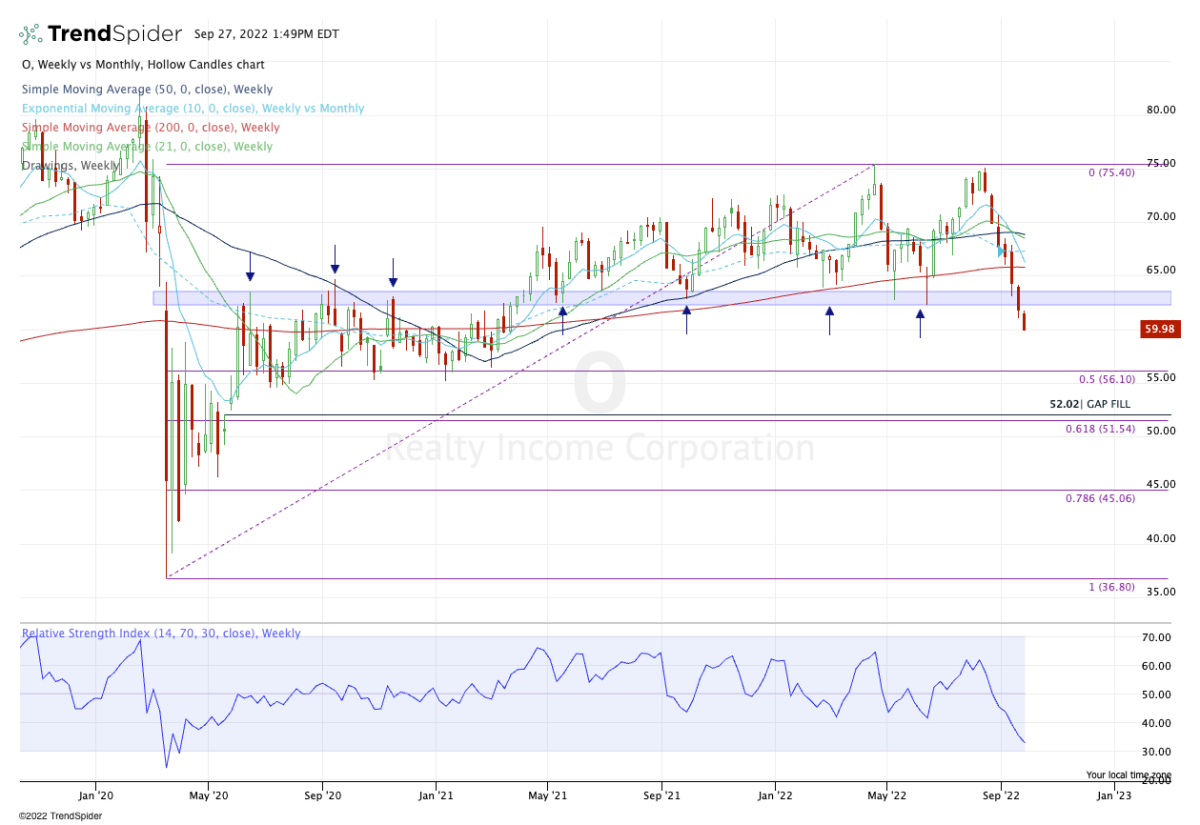
Trading Realty Income StockWeekly chart of Realty Income stock.
Chart courtesy of TrendSpider.com
Realty Income was hit sharply during the covid selloff. In a matter of weeks it fell 55% from the all-time high it hit in February to its lowest level since 2013.
Unlike the rest of the market, though, this REIT did not go on to regain its old highs.
Throughout 2020, the $62.50 area was stout resistance. This level was reclaimed in May 2021 and then became strong support.
Even when the market was making new lows in June, Realty Income stock was holding this zone as support.
But last week the shares closed below this vital area, and with this week’s action, we’re seeing an acceleration lower.
While the shares are feeling oversold, there’s not a lot of support nearby.
Investors need to be careful if they’re buying near current levels. While the yield is attractive, the 10-year yield is almost 4%. Is Realty Income’s current 4.9% yield enough to justify additional risk?
On a rebound, we need to see the stock regain the $62 to $63 area. If it does, it puts the 200-week moving average in play.
If the $62 to $63 area rejects the stock, more downside is possible.
On the downside, I’m keeping an eye on the 50% retracement near $56, which was also a key support area in 2021.
Below that and my eye drifts to the $51 to $52 area, where we find the 61.8% retracement and a gap-fill level that goes all the way back to 2020.
At that price, Realty Income stock will have a reasonable risk/reward balance from a technical analysis perspective and pay a yield north of 5.6%.
