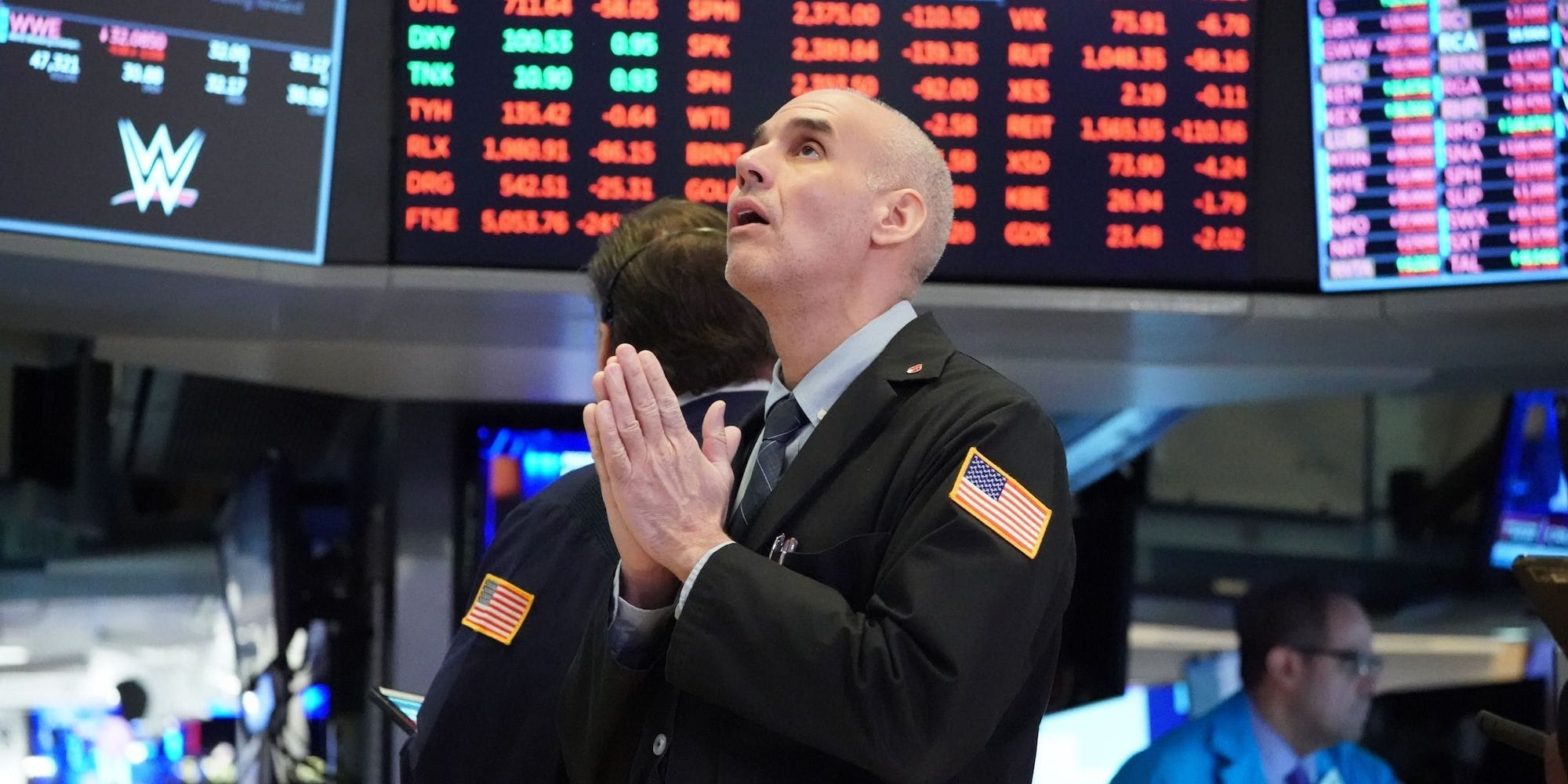
Despite the overwhelmingly bearish stock market commentary towards 2023, there is still one factor that could drive upside.Bank of America’s bull case scenario sees the S&P 500 surging 16% to 4,600 by the end of 2023.”Wall Street is bearish, which is bullish,” BofA’s Savita Subramanian said in her 2023 outlook. Loading Something is loading.
Thanks for signing up!
Access your favorite topics in a personalized feed while you’re on the go.
Wall Street’s attitude towards the stock market in 2023 is overwhelmingly bearish, but that could ultimately be a bullish factor that drives a turnaround in stock prices, according to Bank of America.
A number of equity strategists from Morgan Stanley, Bank of America, and Deutsche Bank have all suggested that the S&P 500 could fall to as low as 3,000 sometime next year, representing a potential decline of about 26% from current levels.
Even Bank of America equity strategist Savita Subramanian said in her 2023 outlook that the base case is a flat year of returns, as investors grapple with a likely economic recession, stubbornly high inflation, and liquidity risks from the Federal Reserve’s balance sheet reduction policy.
But in Subramanian’s bull case scenario for 2023, the S&P 500 could surge 13% to 4,600 on the idea that Wall Street is way too bearish.
“Wall Street is bearish, which is bullish,” she said, pointing to BofA’s Sell Side sentiment indicator that is close to flashing a buy signal. BofA’s proprietary indicator measures sentiment across a group of Wall Street equity strategists, and it has a strong track record of marking a top or bottom for stocks.
When Wall Street is overly bullish on stocks, it typically happens around a top for the stock market, and vice versa when they are overly bearish.
“The Sell Side Indicator has dropped over 6 percentage points year-to-date to 52.8%, closer to a ‘Buy’ signal than a ‘Sell’ signal but still in ‘Neutral’ territory. This level implies price returns of 16.2% over the next 12 months,” Subramanian explained.
A “Buy” signal would be generated if the Sell Side Indicator falls 1.3% from current levels to 51.5%, according to the note, and that could happen as soon as January if the year-to-date pace continues.
“Historically, when the Sell Side Indicator was at current levels or lower, subsequent 12-month S&P 500 returns were positive 94% of the time and the median 12-month return was 22%,” she said.
Contrarian indicators are difficult to time and they don’t always work, as evidenced by overly bearish investor sentiment seen throughout this year and the continued price declines in stocks. But when investor sentiment hits extremes, like it is on the verge of doing based on BofA’s Sell Side Indicator, investors should pay attention.
